Electronegativity increases from left to right across a period and decreases from top to bottom down a group. So the most electronegative elements sit in the upper right of the periodic table and the least electronegative in the lower left. Fluorine is the highest at 3.98 on the Pauling scale, cesium (0.79) and francium (0.7) are the lowest, and noble gases are usually left out.
Electronegativity is how strongly an atom in a bond pulls shared electrons toward itself. This guide explains what the numbers mean, where the Pauling scale comes from, why the trend runs the way it does, where it breaks, and how to use electronegativity differences to tell whether a bond is polar.
What electronegativity measures
Electronegativity describes an atom inside a bond, not an atom on its own. OpenStax defines it as the tendency of an atom to attract electrons, or electron density, toward itself. When two atoms share a pair of electrons, the more electronegative one pulls the pair closer and takes on a slight negative charge, leaving the other atom slightly positive. In hydrogen chloride, for example, chlorine carries the partial negative charge.
Electronegativity is also calculated rather than measured, and it has no unit. That is the main difference from electron affinity, which is measured as the energy change when a single atom in the gas phase gains an electron. The LibreTexts main-group chemistry text notes that electronegativity was developed partly because ionization energy and electron affinity are defined for gas-phase reactions, which makes them hard to connect to bonds in real compounds.
The Pauling scale and where its numbers come from
The values most tables print are Pauling electronegativities. Linus Pauling introduced them in 1932, in a paper on the energy of single bonds and the relative electronegativity of atoms, and LibreTexts notes that his scale is still the one most often used.
Pauling's method starts from bond energies. Take a bond between two different atoms, X–Y. If it were purely covalent, its energy should be about the average of the X–X and Y–Y bonds. Real X–Y bonds turned out stronger than that, and Pauling put the extra strength down to the bond being partly ionic, as the Oregon State University archive of his papers describes. The bigger the extra energy, the bigger the electronegativity difference between X and Y. LibreTexts gives the relationship as EN(X) − EN(Y) = 0.102√Δ, where Δ is the extra bond energy in kJ/mol.
Two things follow from this:
- The scale is relative. The method gives differences between elements, so one point has to be fixed. Pauling put fluorine at the top, and OpenStax describes the result as a relative scale from 0 to 4.
- Rounding varies. Textbooks such as OpenStax round fluorine to 4.0, while data tables such as PubChem list 3.98. Older textbooks also round other elements, for example oxygen to 3.5 instead of 3.44.
Other electronegativity scales exist, such as Mulliken's. They rank elements in a broadly similar order but give different numbers, so don't mix values from different scales in one comparison.
The trend across a period
Across a period, electronegativity rises from left to right. In period 2 it climbs at every step, from lithium at 0.98 to fluorine at 3.98.
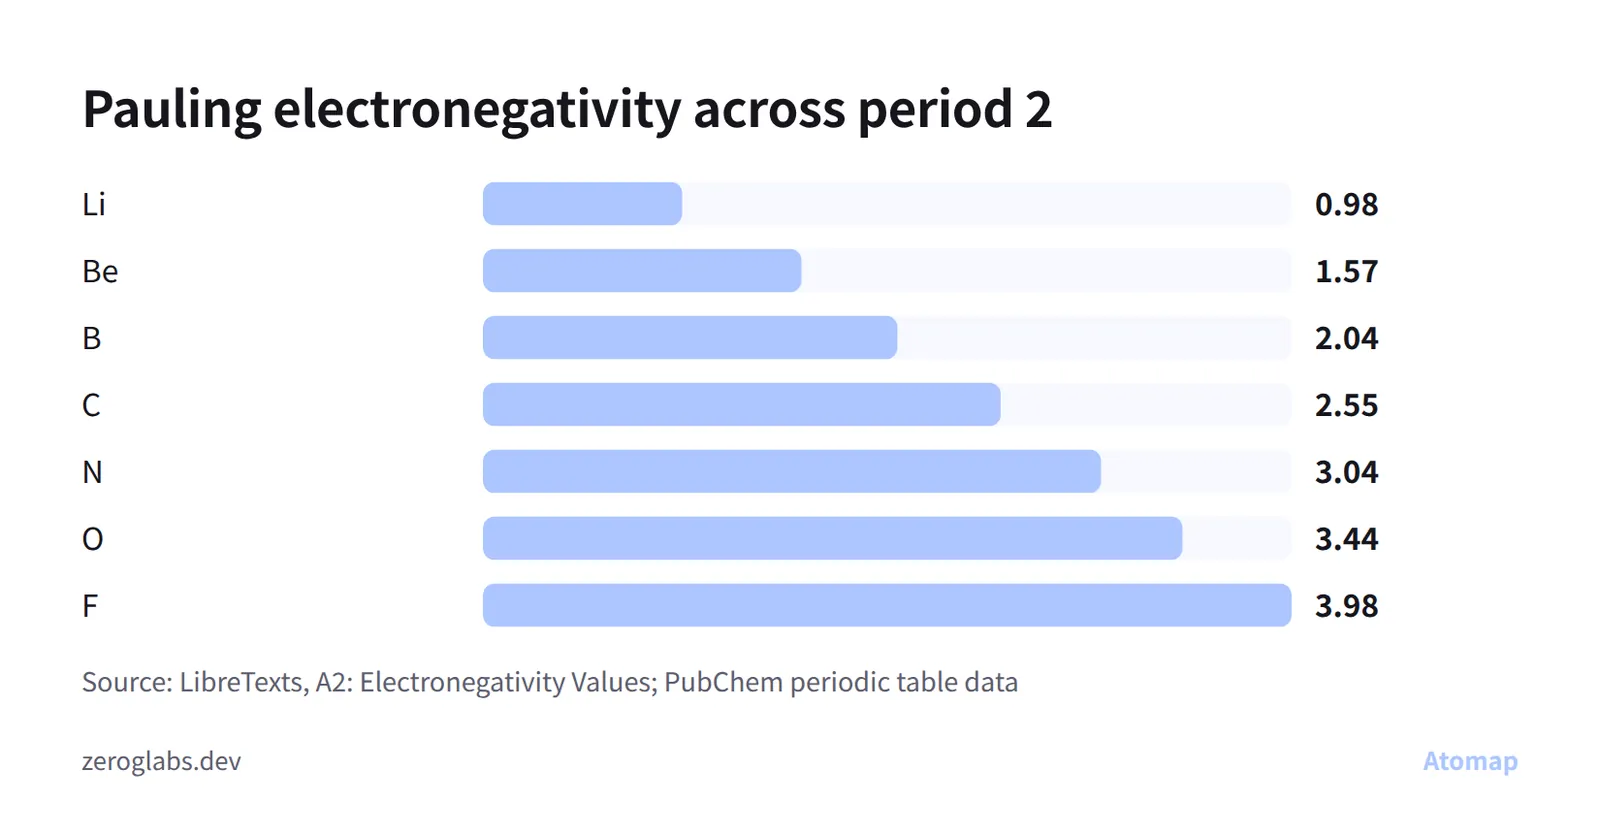
The reason is how hard the nucleus pulls on the outer electrons. Moving one element to the right adds one proton to the nucleus and one electron to the same outer shell. OpenStax explains that electrons in the same shell shield each other only a little, so the effective nuclear charge (the net pull of the nucleus on an electron after the repulsion of the other electrons is taken into account) increases from left to right. Atoms also get smaller across a period, so bonding electrons sit closer to a nucleus that pulls harder.
That is why the metals on the left have low values and the nonmetals on the right have high ones. Period 3 shows the same climb: sodium 0.93, magnesium 1.31, aluminum 1.61, silicon 1.90, phosphorus 2.19, sulfur 2.58 and chlorine 3.16.
The trend down a group
Down a group, electronegativity falls. Each step down adds a new electron shell, so the outer electrons are farther from the nucleus, and OpenStax notes that atoms get larger down a group for this reason. The inner shells also shield the outer electrons. A bonding pair held farther out is pulled less strongly, even though the nucleus has more protons.
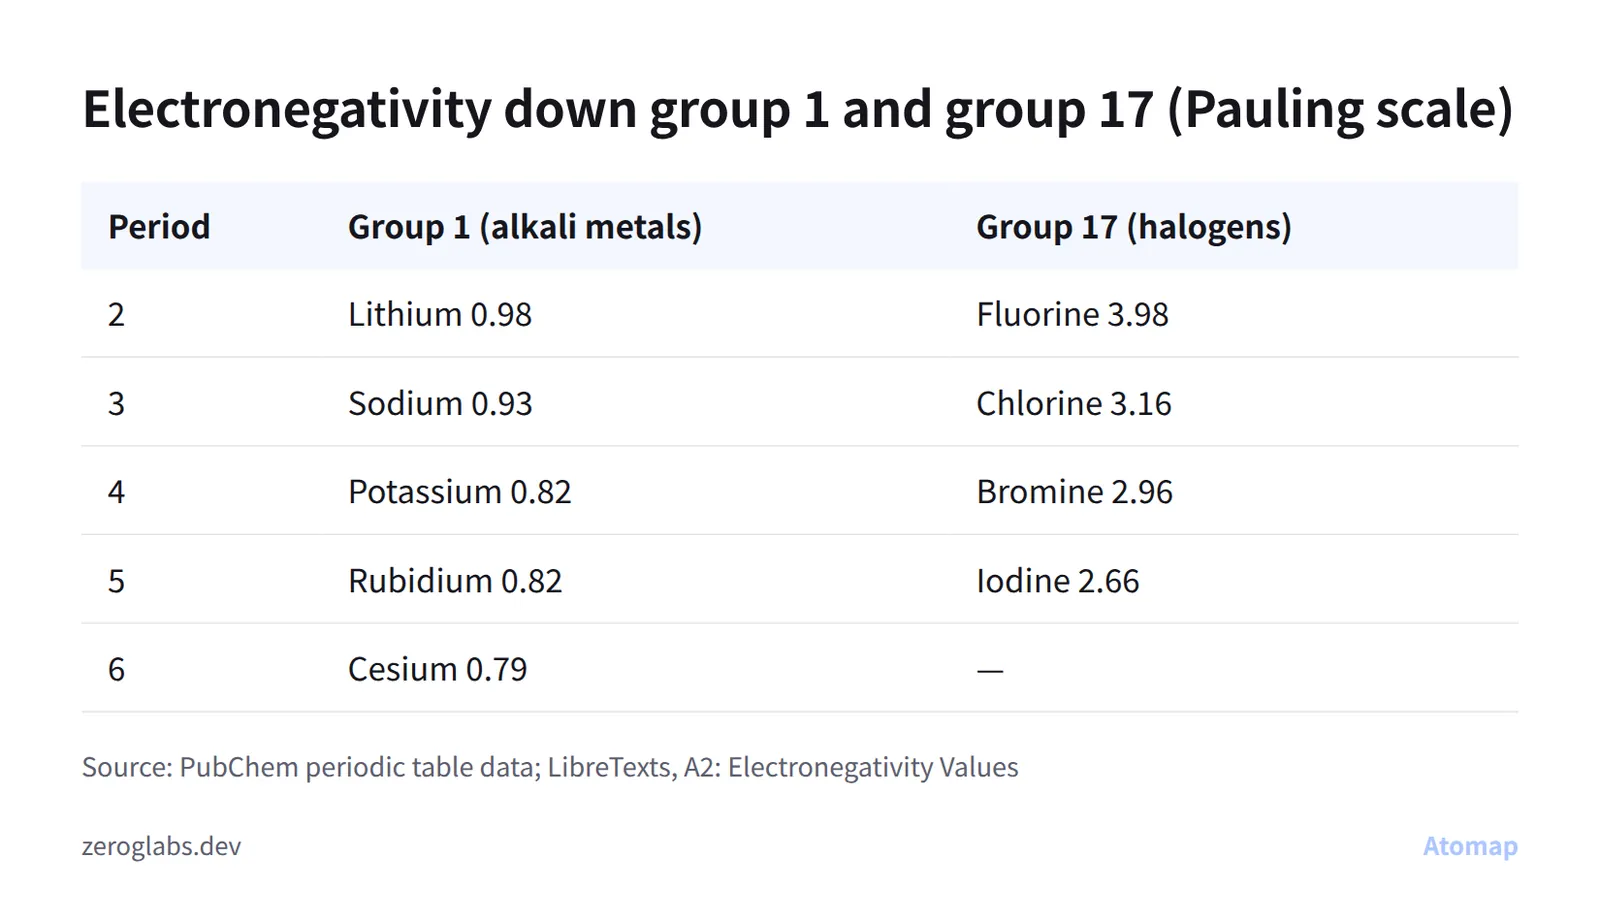
In the halogens (group 17) the value drops at every step, from 3.98 for fluorine to 2.66 for iodine. In group 1 the drop is small, because these metals all have low values to begin with, and it ends with francium at 0.7. Potassium and rubidium share the same value, 0.82, so “decreases down a group” is a tendency, not a rule that every single step obeys.
Put the two trends together and you get a diagonal: values rise toward the upper right. Fluorine, oxygen (3.44), chlorine (3.16) and nitrogen (3.04) have the four highest values in the table. If groups and periods are new to you, our guide on how to read the periodic table explains them.
Where the trend breaks
Treat the trend as a general guide. A few places don't follow it, and they come up often in homework and exam questions.
- Noble gases. OpenStax leaves them out of its electronegativity chart because their full outer shells mean they usually don't share electrons. Pauling values come from bond energies, so helium, neon and argon have no value in PubChem's table. Krypton (3.00) and xenon (2.60) do have values.
- Gallium and germanium. The simple rule says gallium should be lower than aluminum, which sits above it in group 13. Instead, tables list aluminum at 1.61 and gallium at 1.81. Germanium (2.01) is likewise above silicon (1.90) in group 14.
- Gold. Gold, a metal in period 6, is listed at 2.54, practically the same as carbon (2.55).
- Hydrogen. Hydrogen sits above group 1, but its value is 2.20, between boron (2.04) and carbon (2.55) and far from lithium (0.98).
Using electronegativity differences to predict bonds
The bigger the electronegativity difference between two atoms, the more polar the bond between them. OpenStax gives rough cut-offs: a difference below 0.4 means a pure (nonpolar) covalent bond, 0.4 to 1.8 means polar covalent, and above 1.8 means ionic.
With the Pauling values from this guide:
- C–H: 2.55 − 2.20 = 0.35, essentially nonpolar.
- O–H: 3.44 − 2.20 = 1.24, polar covalent, with the partial negative charge on oxygen.
- H–Cl: 3.16 − 2.20 = 0.96, polar covalent, with chlorine partly negative.
- Na–Cl: 3.16 − 0.93 = 2.23, ionic.
OpenStax, using rounded values, gets 0.9 for H–Cl and 2.1 for Na–Cl, which leads to the same conclusions. It also warns that the cut-offs have many exceptions. HF has a difference of 1.9 but is described as polar covalent, and MnI₂, at 1.0, is ionic. Its practical advice is that bonds between two nonmetals are generally covalent, and bonds between a metal and a nonmetal are often ionic. Use the numbers to compare bonds, such as O–H being more polar than C–H, rather than to force a borderline bond into one box.
Seeing the trend on a color map
A periodic table colored by electronegativity shows the diagonal at a glance, including the spots where it breaks. Atomap, the periodic table and molecules app we make for Android, can color all 118 elements by a property such as electronegativity instead of by category.
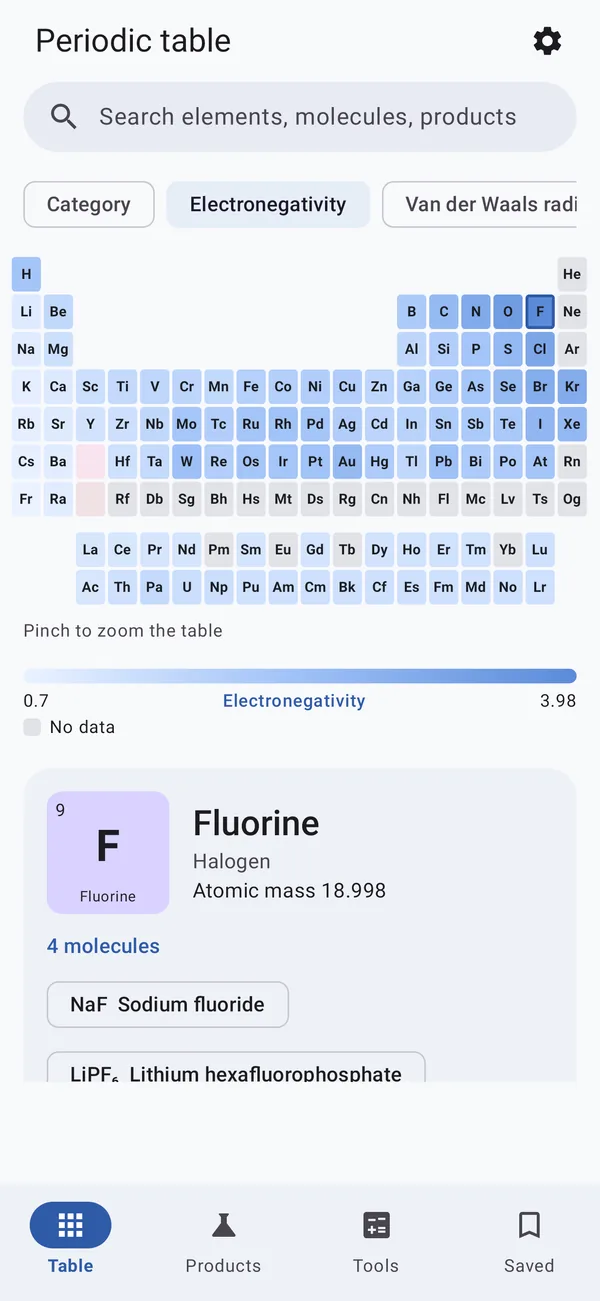
The electronegativity map is one of three free color maps, alongside van der Waals radius and melting point. Switching between the electronegativity and van der Waals radius maps is a quick way to compare the two trends from this guide side by side. On a phone you can pinch to zoom into the table, for example to look at gallium and germanium more closely.
Tapping an element opens its details, including ionization energy, electron affinity and van der Waals radius, the related properties mentioned above, and the molecules that element is in. Twelve more color maps (15 in all) open with a 24-hour pass, which you get by watching an optional ad. The data is built into the app, so it works offline, and each page lists its sources.

Common questions
Which element is the most electronegative, and which is the least?
Fluorine is the most electronegative element, at 3.98 on the Pauling scale (often rounded to 4.0). The least electronegative are cesium at 0.79 and francium at 0.7. Both extremes match the trend: fluorine is at the top right, and cesium and francium are at the bottom left.
Why does electronegativity increase across a period?
Each step to the right adds a proton, while the new electron goes into the same outer shell. Electrons in the same shell shield each other poorly, so the effective nuclear charge rises and the atoms get smaller. The nucleus then pulls harder on the electrons in a bond.
Why don't noble gases have electronegativity values?
Electronegativity describes an atom in a bond, and noble gases have full outer shells, so they usually don't share electrons. Pauling values are worked out from bond energies, so helium, neon and argon have no value. Krypton and xenon are listed at 3.00 and 2.60.
What is the difference between electronegativity and electron affinity?
Electron affinity is a measured energy change when a single gas-phase atom gains an electron. Electronegativity is a calculated, unitless number for how strongly an atom pulls shared electrons in a bond. Both tend to be larger toward the upper right of the table, but they are not the same quantity.
Does electronegativity follow the same trend as ionization energy?
Mostly, yes. OpenStax notes that first ionization energy generally increases across a period and decreases down a group, the same directions as electronegativity. Atomic radius runs the other way: it shrinks across a period and grows down a group.